Whenever I hear the word “average,” I become cautious because averages are typically used to favor one side of a debate. Politicians and financial advisors frequently reference “average” earnings and return increases.
Hearing that average salaries are rising could give the impression that everyone is benefiting from this trend. What if only a handful of previously established millionaires suddenly became billionaires while the rest of us stayed the same?
There are more accurate ways to report data, but this metric is often used because it’s easy to understand and widely used. Averages don’t mean much of anything in the financial markets.
What does it mean, for instance, if the stock market has averaged 5% annually over the past five years? It is demonstrated by the following table, which provides three instances of 5% annualized returns over five years.
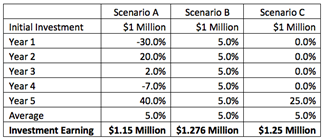
The five-year average is the same in the preceding illustration; however, the dollars created by each scenario are not the same. After five years, an investment of $1 million that earned the returns outlined in scenario A would be worth $1.15 million. Still, an investment that earned the returns outlined in scenario B would be worth $1.276 million. In the end, scenario C would bring a total of 1.25 million dollars. As can be shown, the identical average return does not result in identical outcomes.
The preceding illustration was computed using the arithmetic average, the procedure just described. It is the strategy taught to us in elementary school, and it is the approach used most frequently when calculating averages. After adding all the numbers, you divide the total by the total number of inputs. The formula can be broken down as follows:
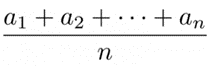
a=portfolio return
n=number of periods
The problem with this strategy is that if a stock drops 20% one year and rises 20% the next year, the investor is still not even. If an investment of $1 million were to suffer a 20% loss, it would be worth $800,000. Even with a 20% increase, your original $800,000 would only be worth $960,000. That’s a loss of $40,000. To break even, the $800,000 would need a 25% increase.
Using the notion of arithmetic average, the table below illustrates the comparable gain for an investment to break even.
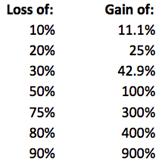
An investment must double in value to break even after a 50% loss. The use of an arithmetic average has this issue built into it. It must gain more on the other side to compensate for a greater loss. It is also important to limit portfolio losses as much as possible. An investment that suffers a 75% loss is doomed to failure. Consistently generating a return of 5% is much more lucrative than obtaining a return of 5% with extreme volatility.
When calculating investment returns, the geometric average is more appropriate. Let me explain how it operates:
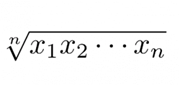
x=portfolio return+1
n=The number of periods
From scenario A above, the geometric mean would be determined as follows:
((1-.3)*(1+.2)*(1+.02)*(1-.07)*(1+.4))^(1/5)-1
A simple calculation reveals that the geometric mean is only 2.21 percent, an annualized return average of 2.21 percent. The return on a $1 million annual investment earning 2.2 percent is the same as the return on a $1 million investment earning 2.2 percent annually. For Scenario B above, the geometric return is exactly 5%, but Scenario C’s return is 4.56. When compounding and volatility come into play at longer horizons, geometric return outperforms arithmetic averages. The stock market’s geometric average was 4.51% from 2000-2017, while the arithmetic average was 6.16%.
The median is a more accurate estimate than the mean when referring to huge data sets unrelated to investment returns since it determines the data’s midpoint and does not allow outliers to influence the results. For instance, this combination of ten numbers shows an average income of $88,500 but a median income of only $40,000.
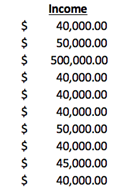
Marketing materials for private investment options are typically laden with demographic and income trend information, making the median a helpful concept to comprehend. Let’s assume that the income of apartment dwellers is reflected in the data set presented above and that the business plan calls for rent increases. If your tenants make, on average, close to $100,000 per year, a rent increase of $100 per month might not seem too excessive. If you look at the middle number, you’ll discover that most tenants have a household income of roughly $40,000, making them considerably more sensitive to a rent rise of $100 per month.
When you encounter the phrase “average,” treat it with suspicion and inquiry. It is essential to understand the limitations of averages to evaluate particular investments and separate fact from fiction. The next time you encounter the word “average” in a quote, ask for clarification on the average used and whether the median has been considered. Understanding these fundamental ideas is crucial in the modern, intricate world of investing.
******************************
Come join us! Email me at mark@dolphinpi.us to find out more about our next real estate investment.