This is an introductory paper to the concept of waterfalls and interest, rates of returns, etc. And by the end of this white paper, you will be able to know what a waterfall is in legal terms, its common types, how to measure it, how it affects interest and how you will be able to use it properly in future endeavors. Along with knowing what particular rates are included, their types, how it can affect your funds and transactions and many more.
Real estate syndications organize the way cash available for distribution from operations, sales, or refinance cascades through a series of computations to generate “waterfalls” that convey payouts from a project to the developer and their investors in a pre-arranged hierarchy system.
This white paper uses statistics that have never before been seen in the real estate industry to demonstrate how waterfalls are used across the company.
In order to better comprehend the concept of the “alignment of interest” involving sponsor and investor, the research looks at some of the most common, rarest, and complex waterfalls. Data from Investor Management Services (IMS), the industry leader in investor management software, is combined with information from several independent sponsor transactions.
This article can aid sponsors who are looking for money online by giving them a range of conversation starters based on primary facts.
Abstract
Real estate syndications set up the way that money that is available for distribution from operations, sales, or refinancing cascades through a series of calculations to create “waterfalls” that transfer payments out of a project to the developer and their investors in a previously decided hierarchical order.
There has been a paucity of understanding regarding waterfalls until now since restrictions have effectively limited the distribution of this information, and as a result, best practices have depended on educated assumptions rather than objective evidence. Even though there are many different methods to construct waterfalls, once a developer has come up with a structure that worked for them, they are rarely willing to change that formula since access to industry standards has restricted.
Since recent legislative advancements provided an opportunity for both real estate syndications and their sponsor to search for investors online, the data used to analyze how waterfalls are utilized in the industry has evolved from closed private groups to a more open, accessible model. We combine data from Investor Management Services (IMS), the leading company in investor management software, with an analysis of a wide range of independent sponsor transactions to examine the most common, rarest, and most complex waterfalls and to evaluate how various waterfalls can aid in understanding the concept of the “alignment of interest” with both sponsor and investor.
The foundation of the entire syndication process is the amount of revenue a sponsor can show they generate for their investors. This is determined by the waterfall framework they employ, how it stacks up against other sponsors and developers in the industry, and how they use this data to tell a narrative for their projects. With the help of this article, sponsors may incorporate a variety of conversation topics based on primary data within their value proposition while seeking funding online.
Introduction
Every real estate syndication’s investor search begins and concludes with the response to a single, straightforward question posed by every potential investor:
How much will you earn for me?
Even if investors aren’t asking, it is the overriding question on their minds, and it obliterates whatever else a sponsor may be saying. Recently sticking with the same structure worked fine since real estate syndications were in small, closed-door groups where no one knew what the other guys were up to. Most sponsors have been utilizing the same waterfall for years, perhaps a few minor adjustments along the way. This is a result of legislation that made investment solicitation illegal without having a previous connection to them.
Investors may immediately compare projects to each other since sponsors can actively syndicate agreements online utilizing cutting-edge internet marketing. Sponsors must understand how their waterfall compares to ranking those of their competitors to stay on top of the game and be relevant to the modern era. They also need to know how to apply this knowledge to successfully syndicate their agreements online.
Combining the author’s expertise in real estate investing and finance with compiled data from investors, the data in this study includes previously unseen information on waterfalls. The pioneer in investment management software is Management Services (IMS).
The method through which earnings and cash flow are distributed to investors is called a “waterfall.” in what amounts and sequence, and developer-sponsor.
IMS Statistics (Q1 2019):
- 500 client sponsors
- 65,000 international traders
- 7,000 commercial property ventures
- $40B equity stakes highlighted
Note: IMS facilitates efficient investor and investment management.
The Most Common Waterfall Structures – A formula used commonly by independent sponsors in private equity financing.
• Preferential return of 8%
• Capital recovery
• After that, either a 90-10 or an 80-20 Profit sharing, sponsors-investors respectively.
As compared to independent sponsor waterfalls, institutional waterfalls are usually found to include the following:
• Preferred return of 8%
• Return on investment
• A 70/30 profit split until investors reach an IRR of 15 percent.
• Then a split of 60-40.
Waterfalls become increasingly complex as additional layers are added, with a typical structure that is like this:
• 8 % preferred
• Return on investment
• A 70/30 profit split up to an IRR of 12 percent is received by investors.
• Next, a 60-40 split is used until investors obtain an IRR of 15%.
• A 50/50 split of the remains
The breakpoints might vary depending on what stage of the process a project is funded, but certain structures stay the same.
The IRR thresholds were far higher in the initial years of recovery after the 2008–09 crisis than they are now in the latter stage of a cycle, with the top breakpoints over 20% IRR and seldom obtaining a 50–50 with sponsors.
These multi-level waterfalls differ depending on the risk profile of the deal, whether it is opportunistic, ground-up, value adds, core, or core-plus. They are mostly found in institutional circumstances.
Equity multiples are used by uncommon waterfall outliers such as breakpoint measurements and appear as follows:
- 8 percent preferred return
- Return of capital
- Profits are divided 70:30 until investors attain a 1.15 equity multiple
- Then a split of 60:40 before investors attain a 1.5 equity multiple
- Then a 50-50 split.
IRR
Internal rate of return (IRR), which makes up around 80–85 percent of all obstacles employed across the industry, is the most often utilized test to advance to a subsequent level in waterfalls. The project’s preferred returns include the following.
follows, with 8% is by far the most typical:
A fundamental two-level waterfall
About 75% of all projects use waterfalls with merely a desired return and a share of revenues over that.
In order of frequency, other breakpoint tests are as follows:
- Attaining the desired level of return as agreed upon
- Amount of recovered money
- The equity multiple
- The percentage of the desired return paid out
All the waterfalls that have come before have one thing in common: they all feature a single waterfall structure that accounts for both distributions from operations and payouts from capital events like refinancing or sales. This building takes place in over 75% of all waterfalls.
One waterfall is used for cash distributions from operations, while the other is used for cash dividends from refinancing or sale events. This is how some sponsors want to divide their waterfalls. About a quarter of all waterfalls have these sorts of structures.
The prerequisites for more waterfalls are added by outliers.
The difficulties that result from the transaction structure itself are what make waterfalls the most challenging, not the number of stages or the presence of bizarre threshold requirements.
The fundamental organizational elements may be seen in the image below, where a GP and LP have acquired the property-owning firm.
This page displays the project’s equity split, which is 90-10. The investments totaling $3.6 million from investors and $400,000 from the sponsor, or a total of 90% and 10%, respectively, have been made.
The most fundamental structure is as follows, although negotiations might start to take the following form when they get more complex:
This depiction of a transaction is accurate. This project has six different courses, each of which was divided into a different class and had a distinctive waterfall.
The most popular program for calculating waterfalls, Excel, is pushed to its computational limits by these sorts of structures.
The figure below shows another illustration of a similarly complex transaction structure.
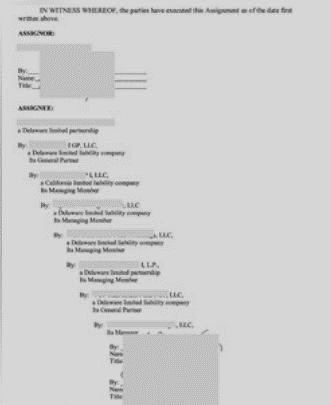
The organization of seven entities, each represented by a signature block, in a rather complex nesting arrangement, one was nested within the other structure.
Conclusion
Before the invention of online general solicitation, the data mentioned in this study could be obtained anecdotally. Investors and sponsors now can understand what is typical and what deviates from the norm thanks to the abundance of data that is currently available, and as internet syndication of real estate deals becomes more commonplace, this sort of data will only grow more thorough and granular.
Investors are now interested in comparing a sponsor’s agreement structure to others, which has never been possible.
The ideal approach for sponsors to share that narrative with investors is by using the channels that investors use to get information today, such as their websites, online opinion articles, audio or video content, and social media.
Section II – Measuring Interest Alignment
Introduction
For sponsors and investors to gauge how closely a waterfall adheres to industry norms, the first phase of this study looked at industry standards and outliers.
The waterfall does not guarantee an alignment of interests just because it is widely employed.
Providing that message is well conveyed to investors, another strategy a sponsor may employ to promote their value proposition would be to explain how their waterfall compares to that of rivals. The proprietary waterfall tool created by IMS is used in the next section to assess how various waterfalls compare to a sample transaction.
This section offers sponsors insight into not just how their current waterfall splits returns among them and their investors but also a window into how to communicate the crucial “alignment of interest” to investors in a manner that has never been previously employed.
By showcasing a cutting-edge approach to project structure analytics, sponsors may utilize this information to increase the money they get from current investors to grow their investor networks.
Measuring the Waterfall
The information in this part, like the one before it, is unique. It is now available for the first time due to the 2012 JOBS Act, which allows sponsors to raise cash online from authorized investors. Investors may use any medium, anywhere, at any time.
Because real estate syndications’ usage of waterfall structures has subsequently investors may now compare one transaction to another since online solicitation has increased transparency. It is now essential to know how a waterfall compares to competitors and be able to explain why it is fair to investors to make a convincing presentation. In the battle for online capital, sponsors that can effectively communicate these findings through their digital marketing initiatives stand to gain significantly.
The author worked with IMS, the largest provider of investment management systems for commercial real estate, to produce a data set that shows the relative returns that different waterfalls provide. Five distinct waterfalls are put through a sample real estate deal to examine how they function; the findings allow sponsors to evaluate their waterfalls to those of other sponsors.
The five various waterfall patterns that were looked at comprised the following:
| Project Pref Split #1 Hurdle Split #2 | ||||
| 1 | 8% | 70/30 | n/a | |
| 2 | 10% | 80/20 | n/a | |
| 3 | 10% | 80/20 | 15% IRR | 60/40 |
| 4 | 8% | 70/30 | 15% IRR | 50/50 |
| 5 | 8% | 70/30 | 1.6x Emx | 50/50 |
They were examined to see which one provides the sponsor and investor with the highest profits and which one most closely aligns with their interests. All have IRR breakpoints, except for Project 5, which used the equity multiple before moving on to another level in the cascade.
Every trade is unique, making comparisons hard, thus to compare apples to apples, each underwent a single fictitious transaction which looked like this:
Property Cost: $10 Million
Total equity needed: $4 million
Share of investor equity: 90%
Sponsor co-investment: 10%
Other less significant hypotheses that were maintained ceteris paribus throughout the study were also included.
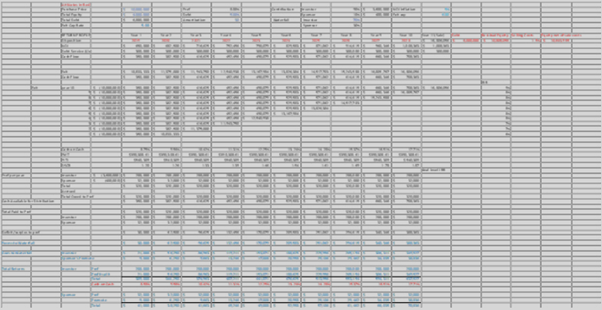
Sponsors generally do assessments like this by opening Excel and preparing spreadsheets out of habit, having done it for the preceding 30 years.
However, running several waterfall scenarios in Excel is quite challenging, especially when overlaying various divides and classes across various ownership entities.
It would resemble this, but with more pages to handle the various obstacles and perhaps a dashboard to summarize and compare outcomes.
This outdated method of performing waterfall calculations in Excel takes a lot of effort and is prone to mistakes. Liability problems arise if these estimates are incorrect. Excel usage is comparable to using an abacus today, although sponsors have become accustomed to it over time.
IMS’s exclusive waterfall tool made the process easier and made it possible to compare several situations with ease.
The Results
Results from traversing the five waterfalls are displayed on the graph below at the sponsor level through the hypothetical agreement:
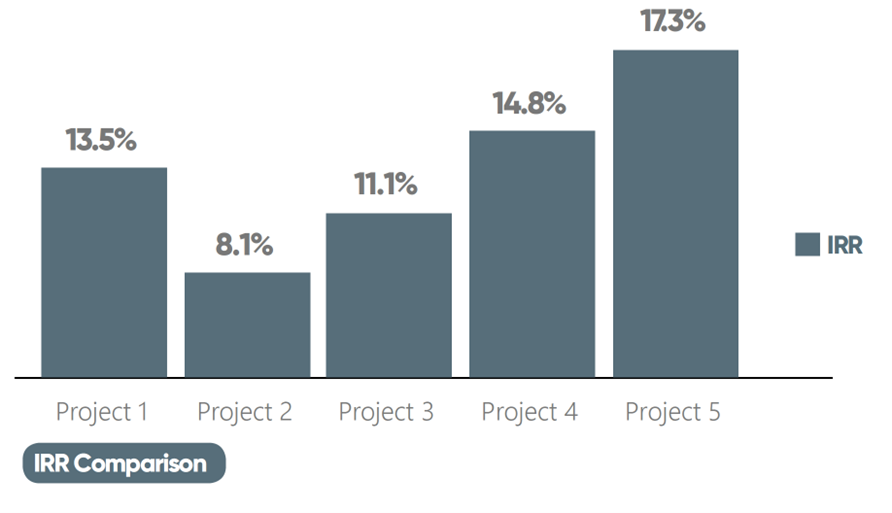
The least beneficial scenario for sponsors, i.e. the one with the lowest IRR, is Project (waterfall) 2, which has an 8.1% IRR (10% preference, to an 80-20 split), the most favorable is Project 5, which has a 17.3% IRR and is also the waterfall with the equity multiple.
____________________________________________________________________________
The figure below illustrates the investor IRR return comparison, which is the inverse of the sponsors’:
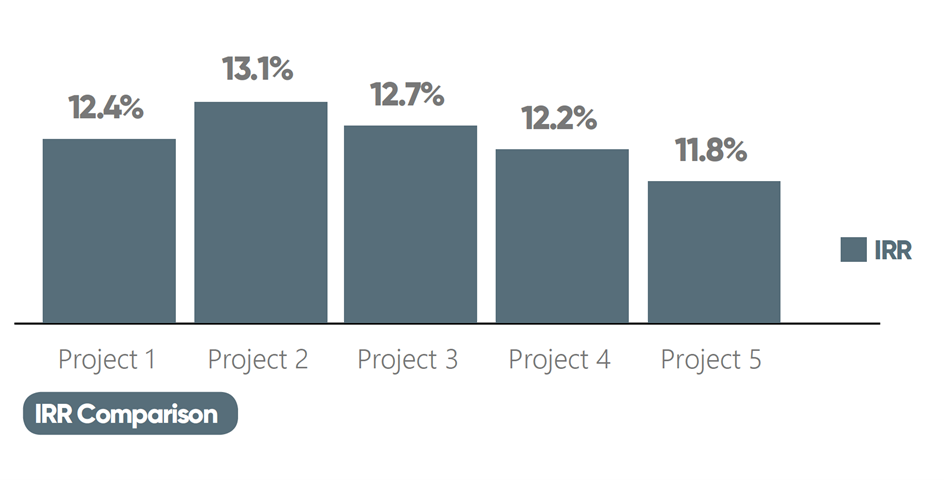
In this study, Project 2 is the most advantageous scenario for investors (10% preferred an 80-20).
Alignment of Interest
To examine how interests are matched, the study examined a comparison of sponsor and investor level returns. The interests of investors and sponsors are increasingly closely aligned when the difference in returns between the two approaches zero.
IRRs are compared between sponsors and investors in the following graph.
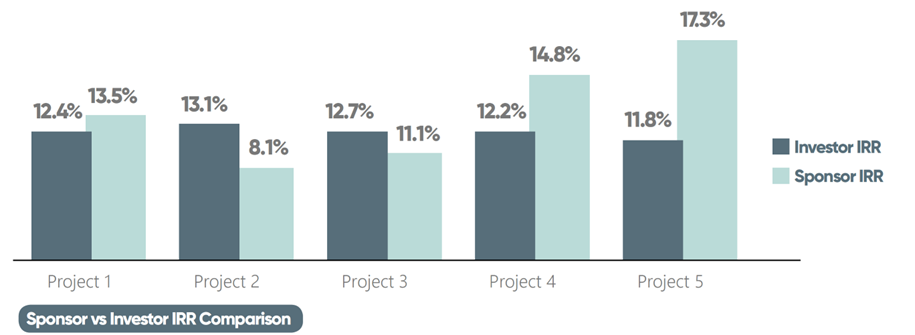
Looking at this delta, Project 1 looks to have an equal split—that is, the split that is closest to zero—with a negative 1.1 difference between the sponsor and investor IRRs. The sponsor in Project 1 benefits from the difference despite it being slight.
| Project Sponsor IRR Investor IRR Delta | |||
| 1 | 13.5% | 12.4% | -1.1% |
| 2 | 8.1% | 13.1% | 5.0% |
| 3 | 11.1% | 12.7% | 1.6% |
| 4 | 14.8% | 12.2% | -2.6% |
| 5 | 17.3% | 11.8% | -5.5% |
Because of this, a sponsor adopting a waterfall structure such as Project 1’s might persuade investors that it offers the best alignment of interests.
The most unfair split is Project 5, which is a waterfall with equity multiple as the breakpoint scenario, for the same reason.
With just a 1.6-point difference in the investor’s favor, it is possible to argue that Project 3 and the investor’s interests are strongly aligned. Until investors attain a 15 percent IRR, there is a 10 percent preference for an 80-20 split; beyond that, the remaining money is divided by 60-40.
True Interest Alignment
Since a number is only meaningful when it is split by some other, the investor and sponsor IRRs taken as a whole do not accurately reflect the alignment of interests.
Most sponsors and trustworthy crowdfunding syndication websites will show both investor and project-level IRR. Sponsors must distinguish between two offering documents so that investors are fully informed.
But what exactly does the gap between the project and investor-level IRRs represent?
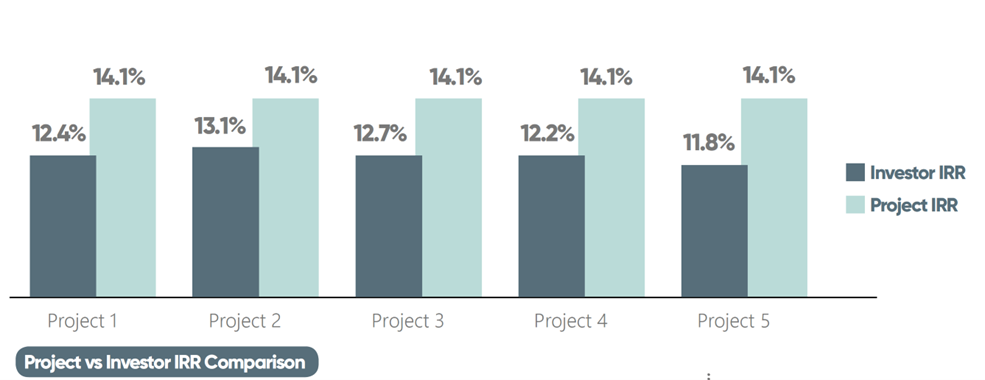
The money the sponsor is taking out of the transaction makes a difference after expenses, and the ratio of the differences in the various waterfalls contrasts the True Alignment of Interest in structures.
While comparing sponsor vs. investor returns, Project 2 has the closest alignment with a difference of just 1.0 percent when we examine the straight subtraction of project-level and investor-level IRRs (10 percent pref to an 80:20 split, to a 15 percent IRR, then 60:40).
The actual amount the sponsor is getting out of a deal after fees are indicated by the difference between the investor IRR and the project level IRR.
| Project Sponsor IRR Investor IRR Delta | |||
| 1 | 14.1% | 12.4% | 1.7% |
| 2 | 14.1% | 13.1% | 1.0% |
| 3 | 14.1% | 12.7% | 1.4% |
| 4 | 14.1% | 12.2% | 1.9% |
| 5 | 14.1% | 11.8% | 2.3% |
Project 2 is aligned when compared to project-level IRR, where the difference between IRRs could only be explained by the returns to the sponsor. Project 1 is most closely aligned when comparing the straight discrepancy between the sponsor IRR and the investor IRR (8 percent prefer to 70-30 split) (10 percent pref, to an 80-20).
But to go even further, the study also considered the ratio of the difference between investor IRR and the project level IRR, not only the actual difference between the two.
Then, by a wide margin, Project 2 has the best alignment, with the lowest divergence ratio of only 7%, as shown in the table below.
| Project | Sponsor IRR | Investor IRR | Delta | As % of Project IRR |
| 1 | 14.1% | 12.4% | 1.7% | 11.9% |
| 2 | 14.1% | 13.1% | 1.0% | 7.0% |
| 3 | 14.1% | 12.7% | 1.4% | 9.8% |
| 4 | 14.1% | 12.2% | 1.9% | 13.4% |
| 5 | 14.1% | 11.8% | 2.3% | 16.2% |
When calculating the ratio on one agreement and comparing it to another, both with their distinct project level IRRs, it offers a clear measure of the alignment of interest between sponsor and their investors. This ratio reveals how much the sponsor is taking out of the deal.
While the author used a hypothetical transaction to compare five waterfalls in this white paper, they have also been used to independent sponsor transactions and projects on crowdfunding platforms. He has noticed that ratios may vary from the high single digits, as in the example case above, to the north of 30%.
Using this Knowledge
Sponsors can employ this information in many ways:
- They should change their waterfalls to conform to industry standards.
- Simplify their waterfall without significantly affecting profit splits.
- Bring investors’ interests closer into line.
- Explain to investors the benefits of waterfalls compared to rivals or industry norms.
____________________________________________________________________________
Presenting a different message might help sponsors stick out in a crowded market where investors are accustomed to pursuing higher IRRs and sponsors are forced to compete to encourage investment online. Talking about alignments of interests or waterfalls concerning standard practices in the sector might be included. Since they are cautious underwriters and refuse to give in to the temptation to change assumptions simply to display a higher IRR, sponsors whose projects don’t exhibit the greatest IRRs on offer might be put at a
a disadvantage in the race for investor funding.
Alternatively, demonstrating that the sponsor’s structure is valid by using one of the ratios. A compelling tale to present and discuss allows for one of the industry’s tightest alignments of interests.
The information in this study is available due to syndication being done online more frequently, which has caused the sector to become more open.
Sponsors may use this information to modify their messaging as they move forward with their capital formation to:
- Give investors and potential investors more in-depth explanations.
- Improve service to current investor networks.
- Increase network to more money raised.
- Maintain an edge over rivals.
The ideal method for sponsors to contend for investor cash and share their distinctive narrative is to conform to how information is consumed by investors, including websites, online opinion articles, video, audio, and social media.
ABOUT IMS
The only all-in-one platform for real estate investment businesses is provided by Investor Management Services (IMS), the industry leader in investment management software. We support our customers in managing their companies more profitably while giving their investors better support. Customer Relationship Management (CRM), Waterfall Distribution Processing, Document Management, Sharing, and Investor Dashboard are all features of the IMS Platform.
See www.imscre.com for further information.
******************************
Come join us! Email me at mark@dolphinpi.us to find out more about our next real estate investment.